Econ01 Introduction to econometrics
Homework 3: Simple Demand Function (two variable cases)
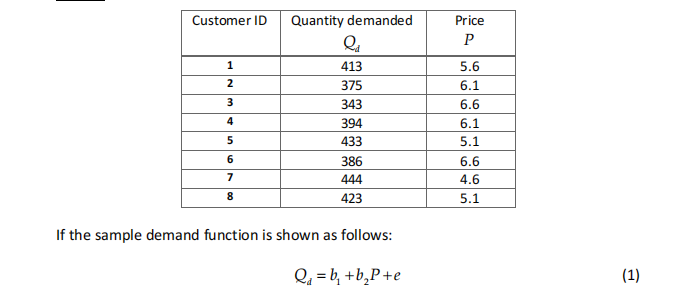
A firm conducted a survey to gauge customers’ quantity demanded for Coke at different prices. The survey results are displayed in the table below:
Table 1

1. Given that model (1) represents a typical demand function, what would be the expected sign of the coefficient b2
?
2. Sketch the demand function where P is the independent variable and Q is dependent variable) (no need to use Excel or EViews).
3. Estimate the linear demand regression (Model 1) by EViews.
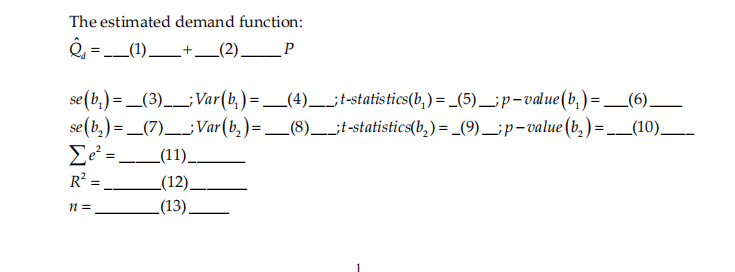
4. Use the EViews outputs to fill in the blanks (3 decimal places).

5. Interpret the intercept and slope of the sample demand function.
6. Use t test to perform hypothesis testing: Check if the slope coefficient is statistically significantly different from zero at 5% significance level.
7. Use p -value to conclude whether the slope coefficient is statistically significant (i.e., b2 ¹ 0 )
8. Interpret the measures of fit
9. What would be the number of cokes consumed when its price is $2?
10. Use the mean values of price and quantity demanded to estimate the price elasticity of demand? Is it price elastic?
Hints:
The price elasticity of demand is defined as the percentage change in the quantity demanded for a percentage change in the price. Mathematically, it is expressed as.
my wechat:_0206girl
Don't hesitate to contact me


